Academy
Elevate your team
Maximize your team’s performance with our data expertise courses, designed to convert data into strategic action.

Advantages
Elevate your business with targeted BI training
Develop a competitive edge with our strategic BI courses, tailored to empower your team with the skills needed for data-driven decision-making.
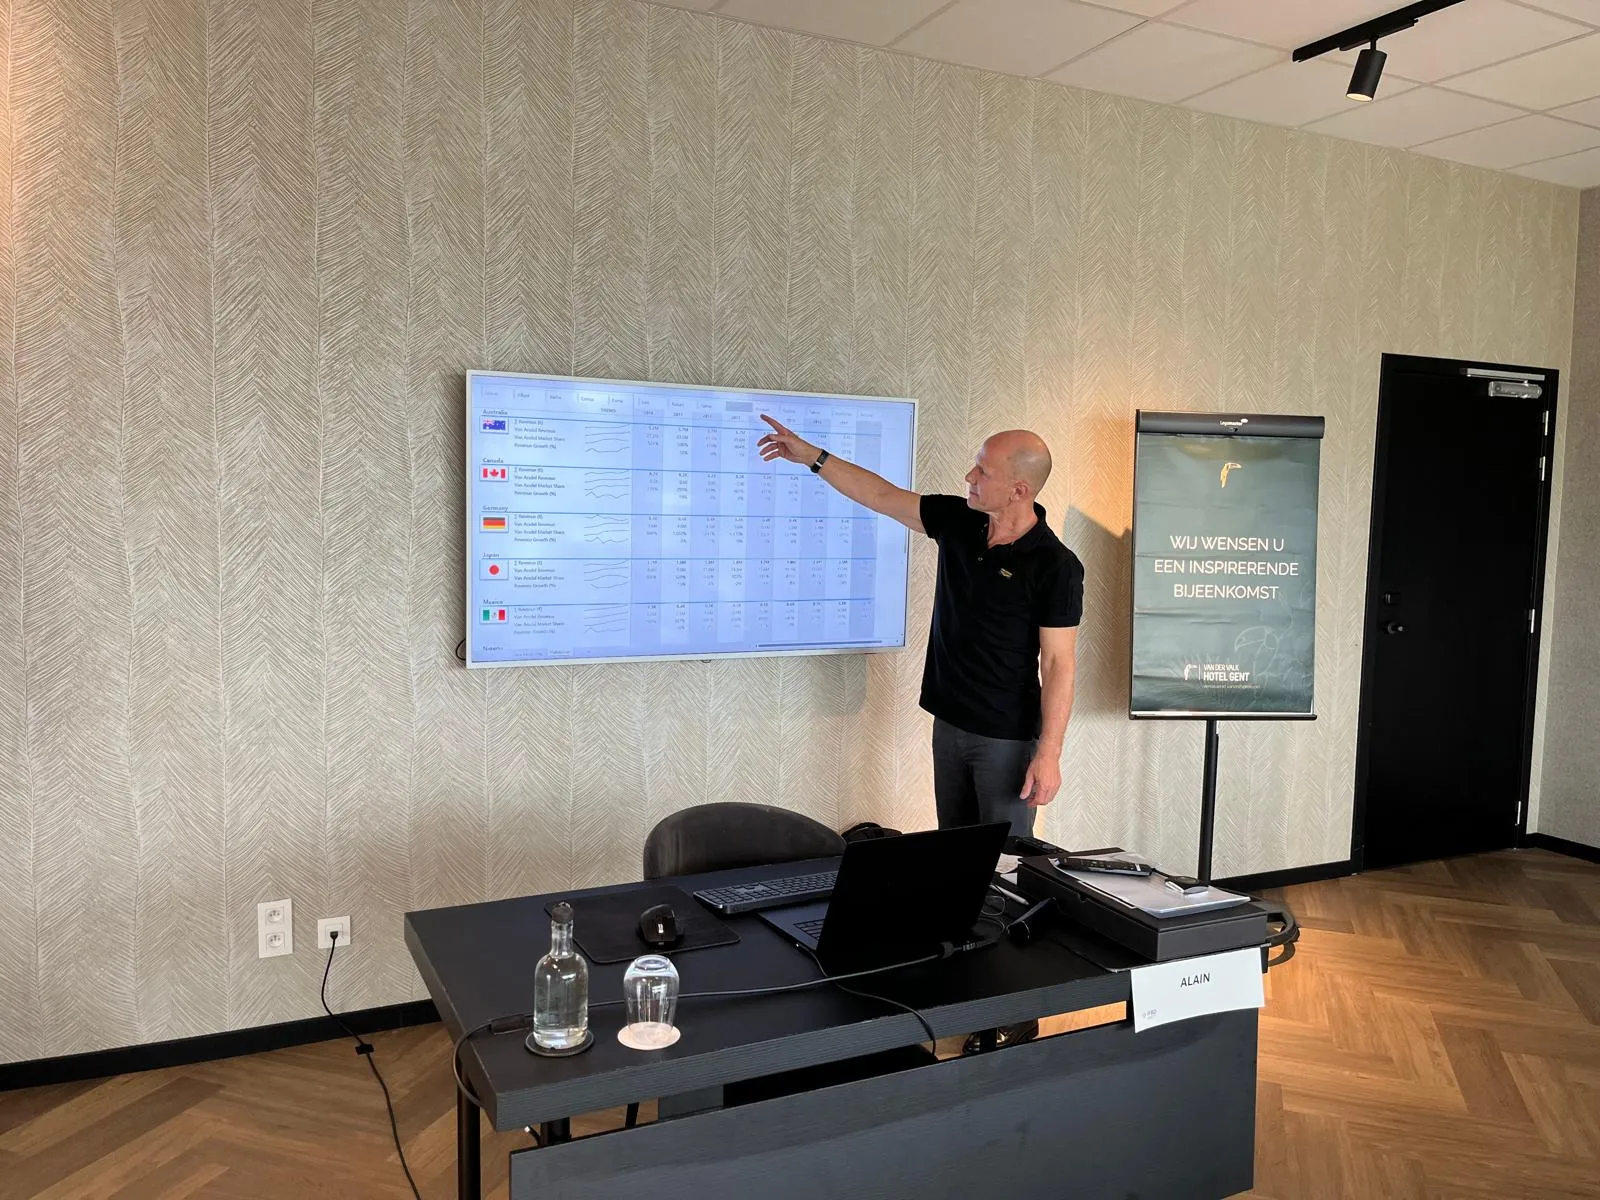
Explore our training at the Corda Campus
Data vormgeven met Power Query
Een “hands-on” training, boordevol best practices, die business professionals leert hoe ze Power Query efficient kunnen gebruiken in Excel of Power BI.
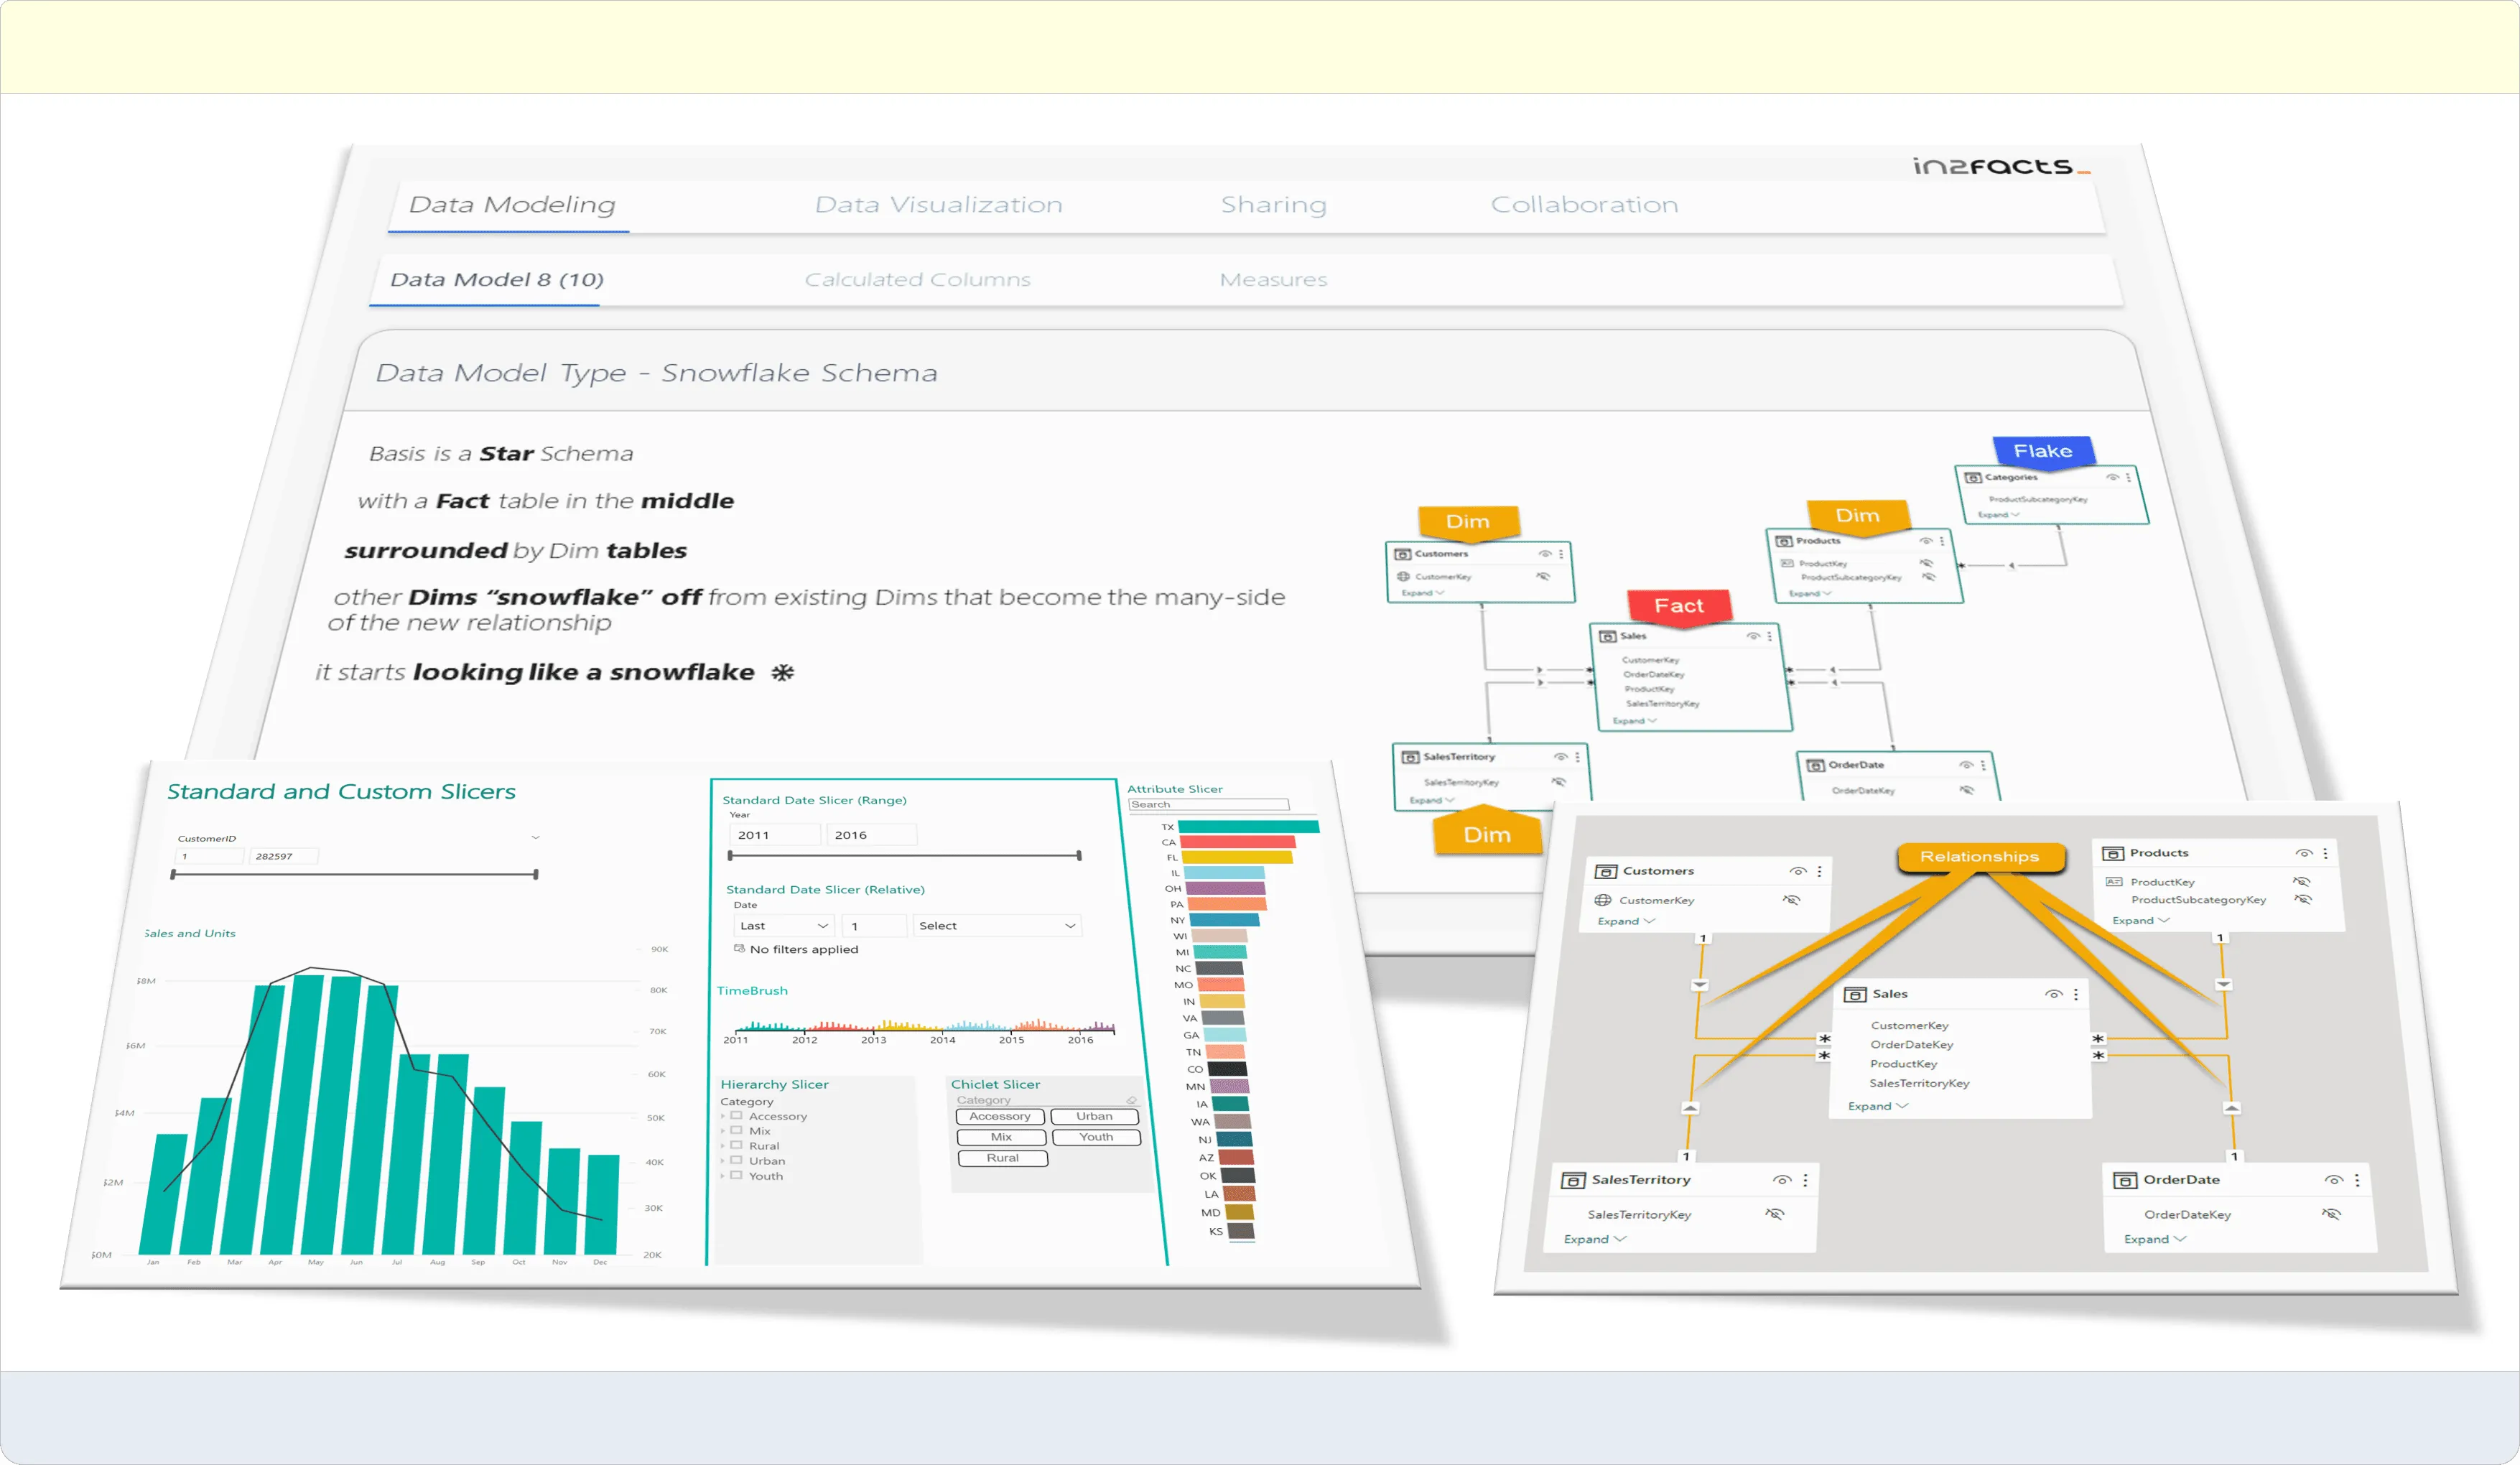
Data Modelleren
Een “hands-on” training, boordevol best practices, die business professionals leert hoe ze efficiënte datamodellen kunnen opstellen en gebruiken in Excel of Power BI.
Data Visualisatie
Een “hands-on” training, boordevol best practices, die business professionals leert hoe ze “state-of-the-art” rapporten kunnen maken die zowel visueel aantrekkelijk als performant zijn.
Explore our diverse IFBD-courses
Power BI Essentials for the business professional
You want to start your journey in Power BI to create stunning reports based on the data you have available. In this one-day workshop you will discover the three cornerstones of Business Intelligence. First you will learn how to extract, transform, and load external data into an analytical database. Secondly, create a semantic model and write some basic analytical expressions. Finally, build report pages to reveal insights.
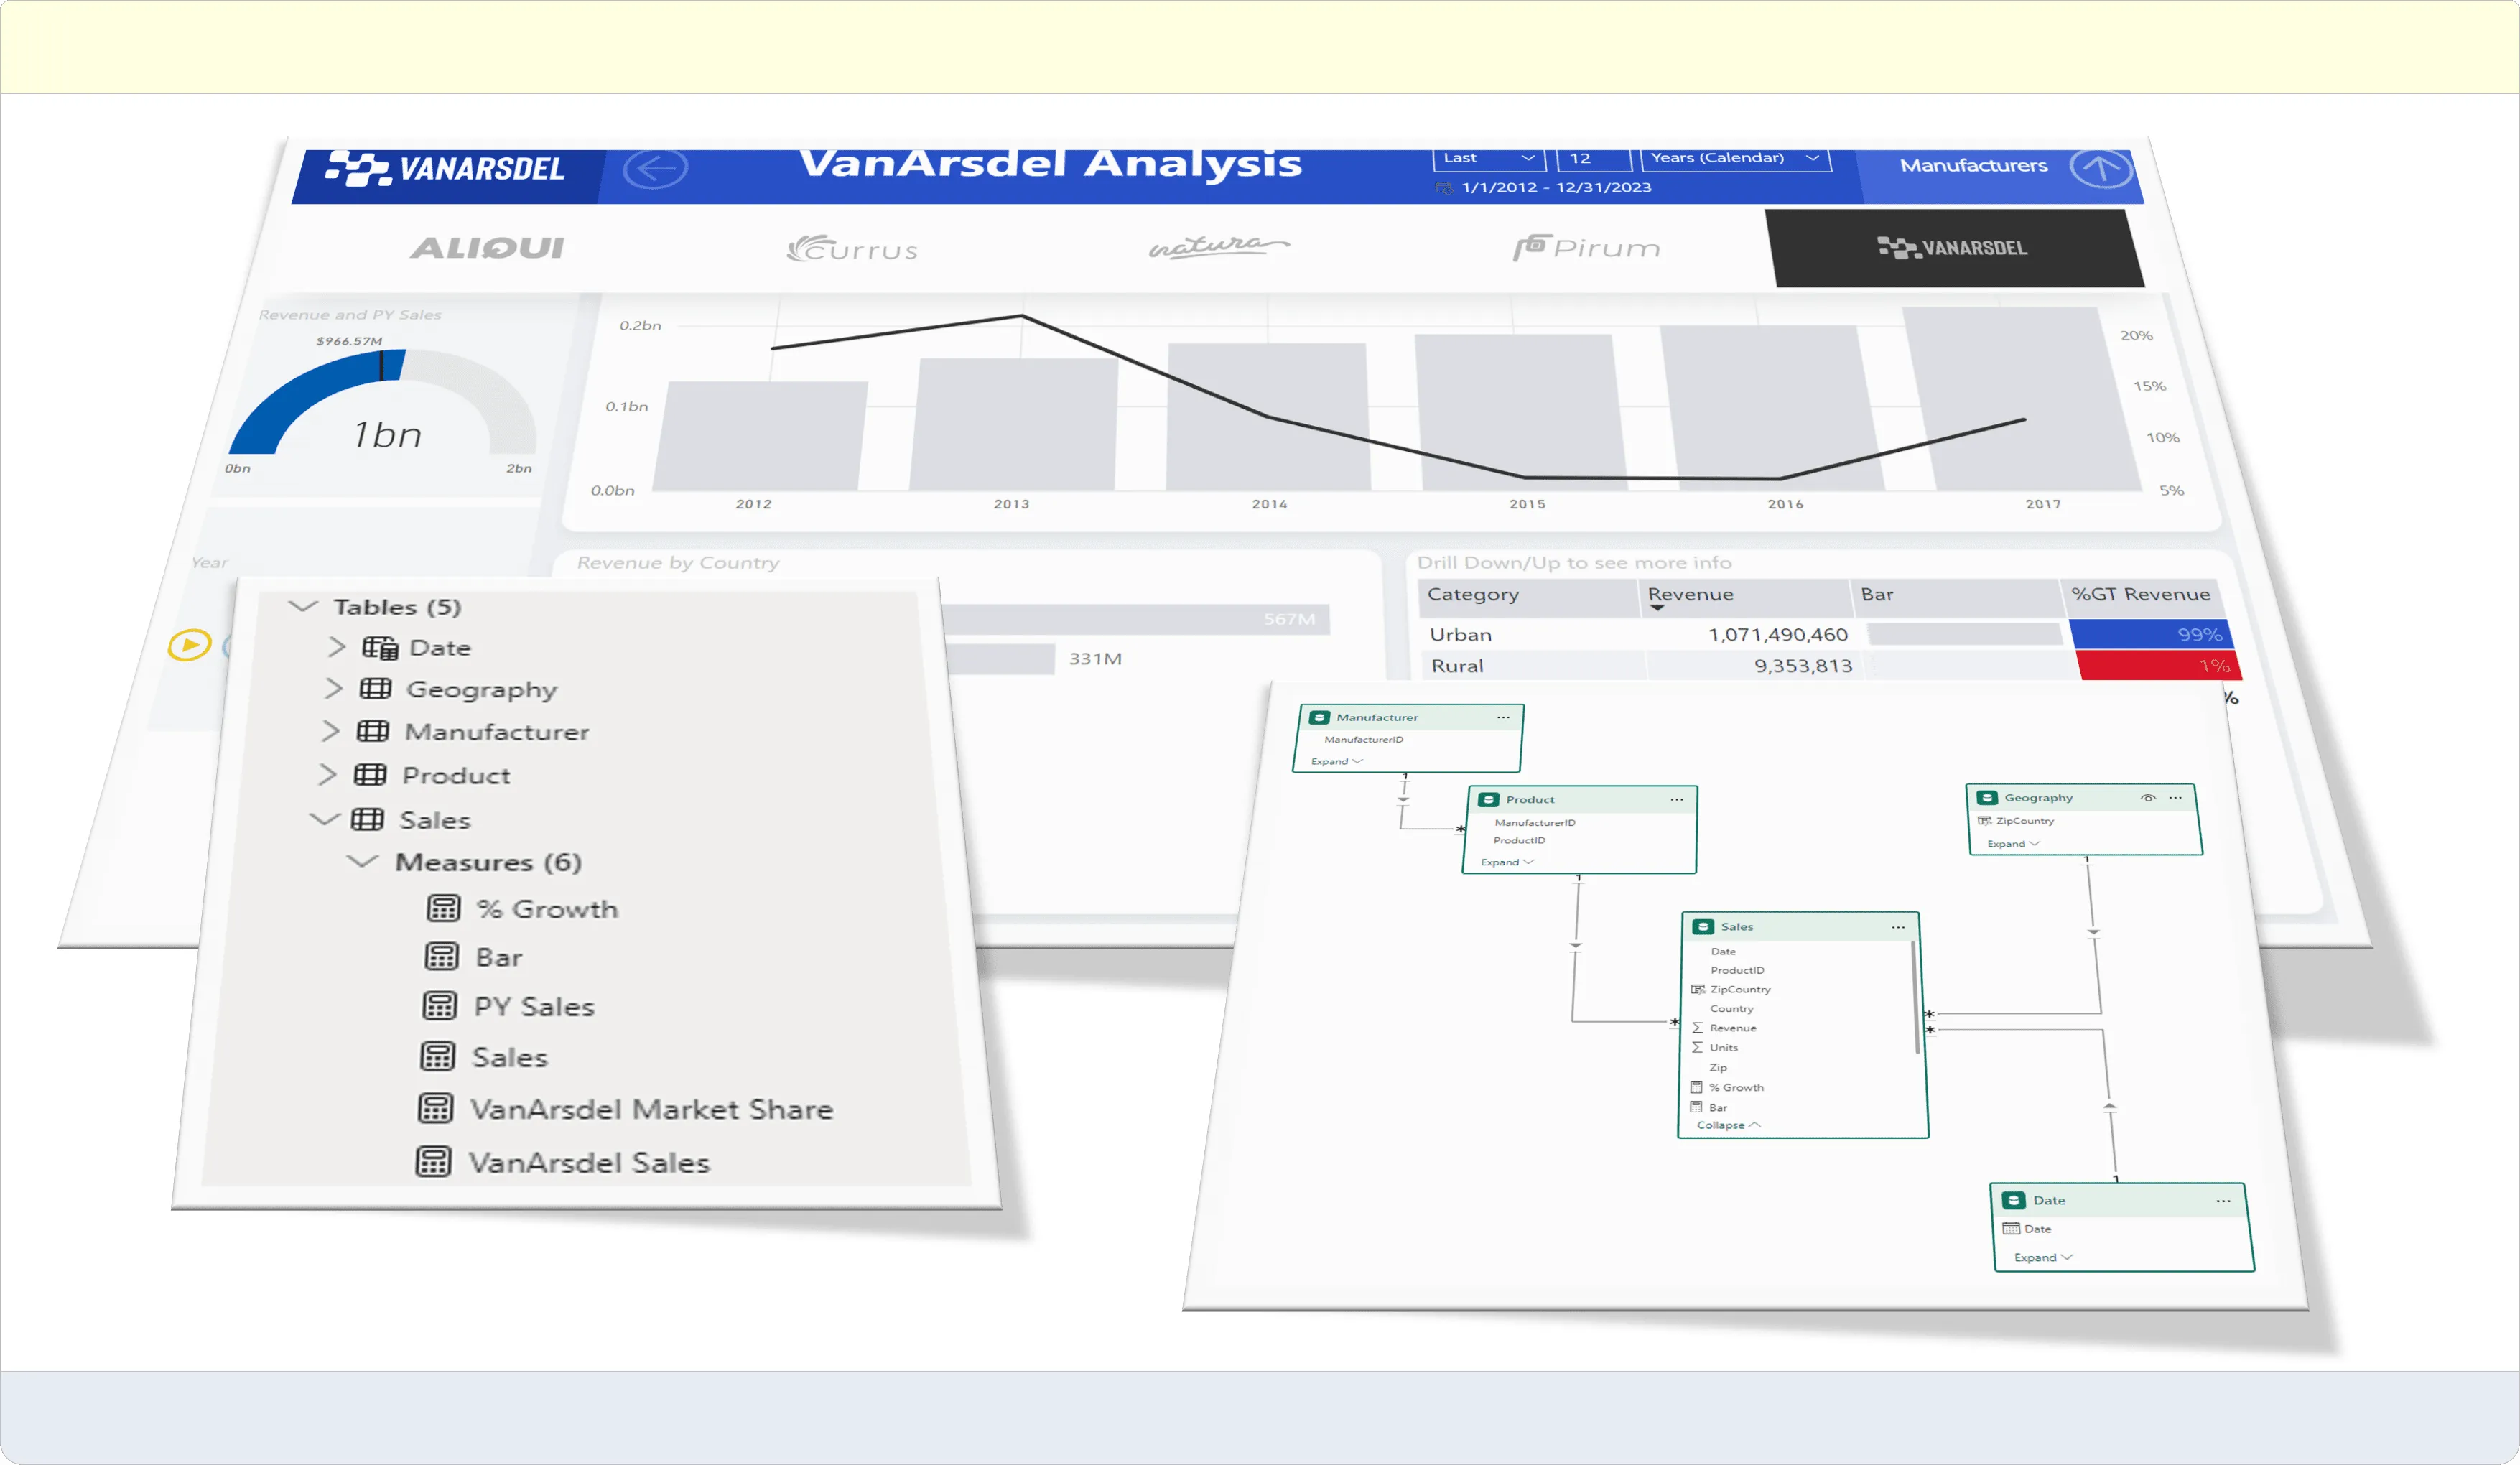
Power BI Advanced for the business professional
You already have acquired essential Power BI skills and want to delve deeper into the data modeling and visualization part, then this two-day workshop will guide you through the powerful features of Sematic Models and building reports. Discover how to develop Time Intelligence measures, variance and performance analysis and lots more. Create appealing report pages while learning best practices in design, layout, and color guidelines.
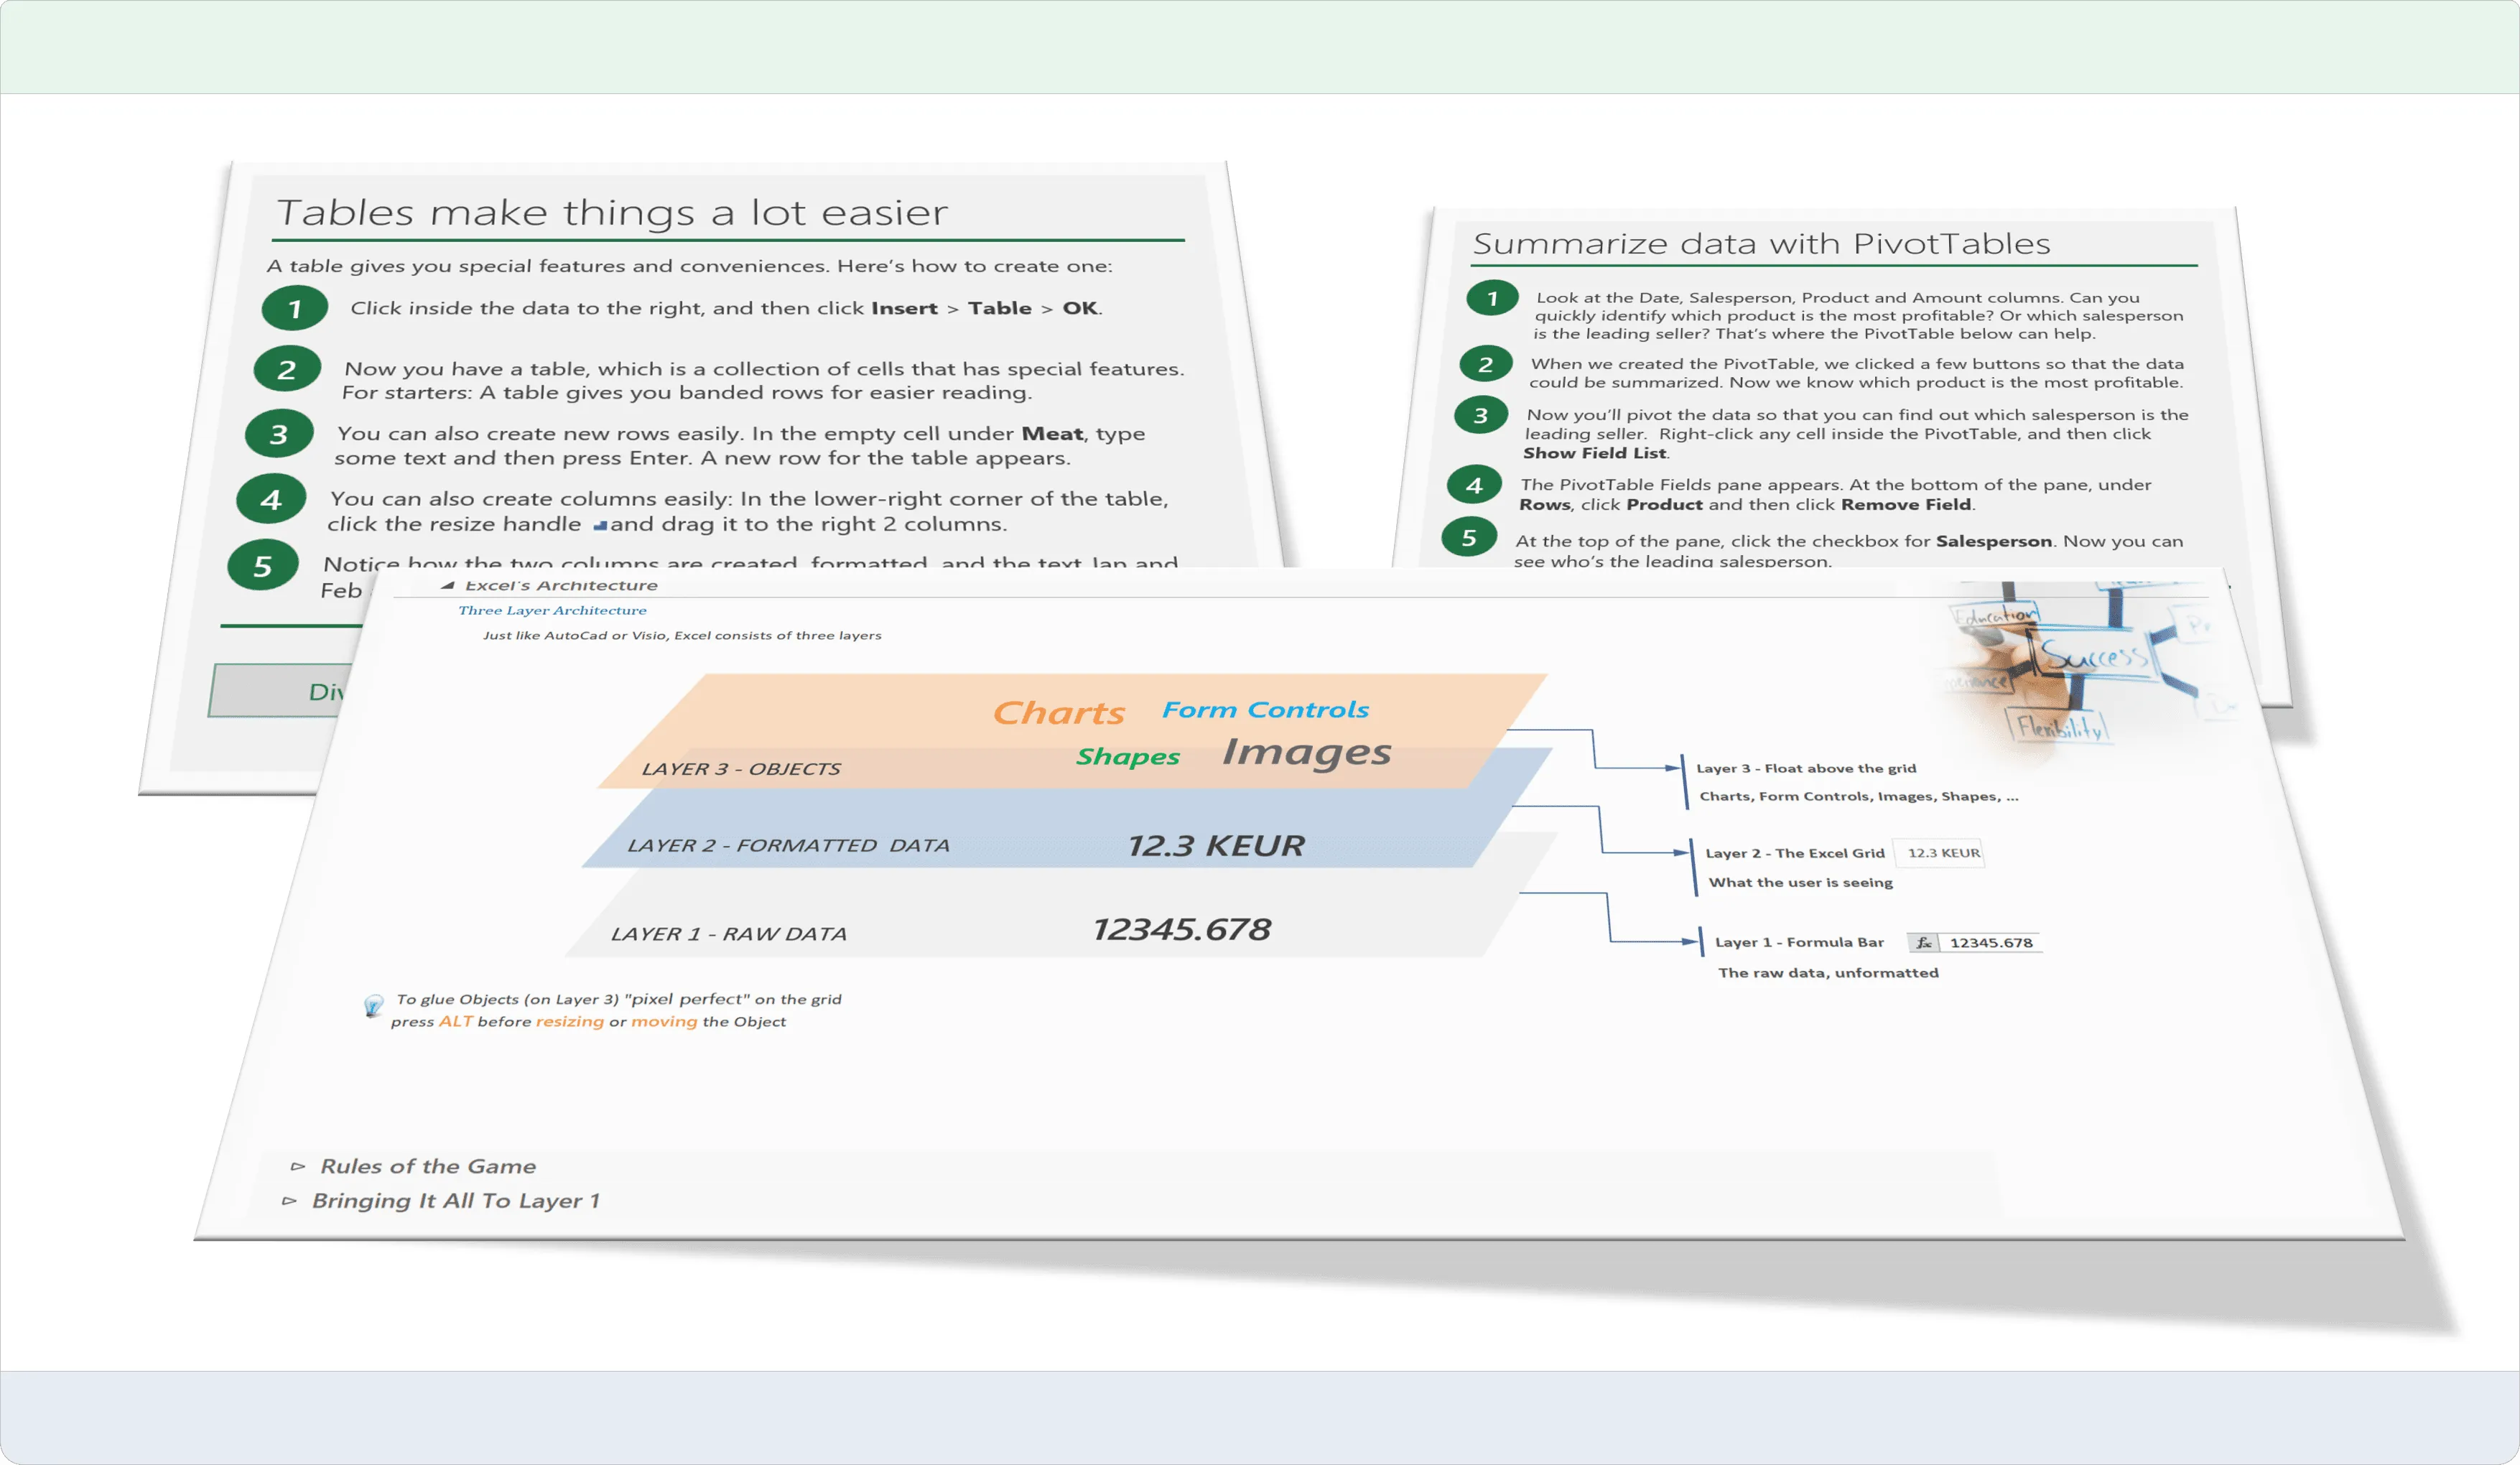
Lean Excel
In this one-day workshop you will be pleasantly surprised by the productivity tips and tricks to give your daily Excel activities a new boost. Starting from scratch the course will give you a totally new insight in the world of Excel. Including productivity shortcuts, working with Tables and summarizing data with PivotTables, using AutoFill and FlashFill to reduce your tasks to a minimum. An investment well spent!
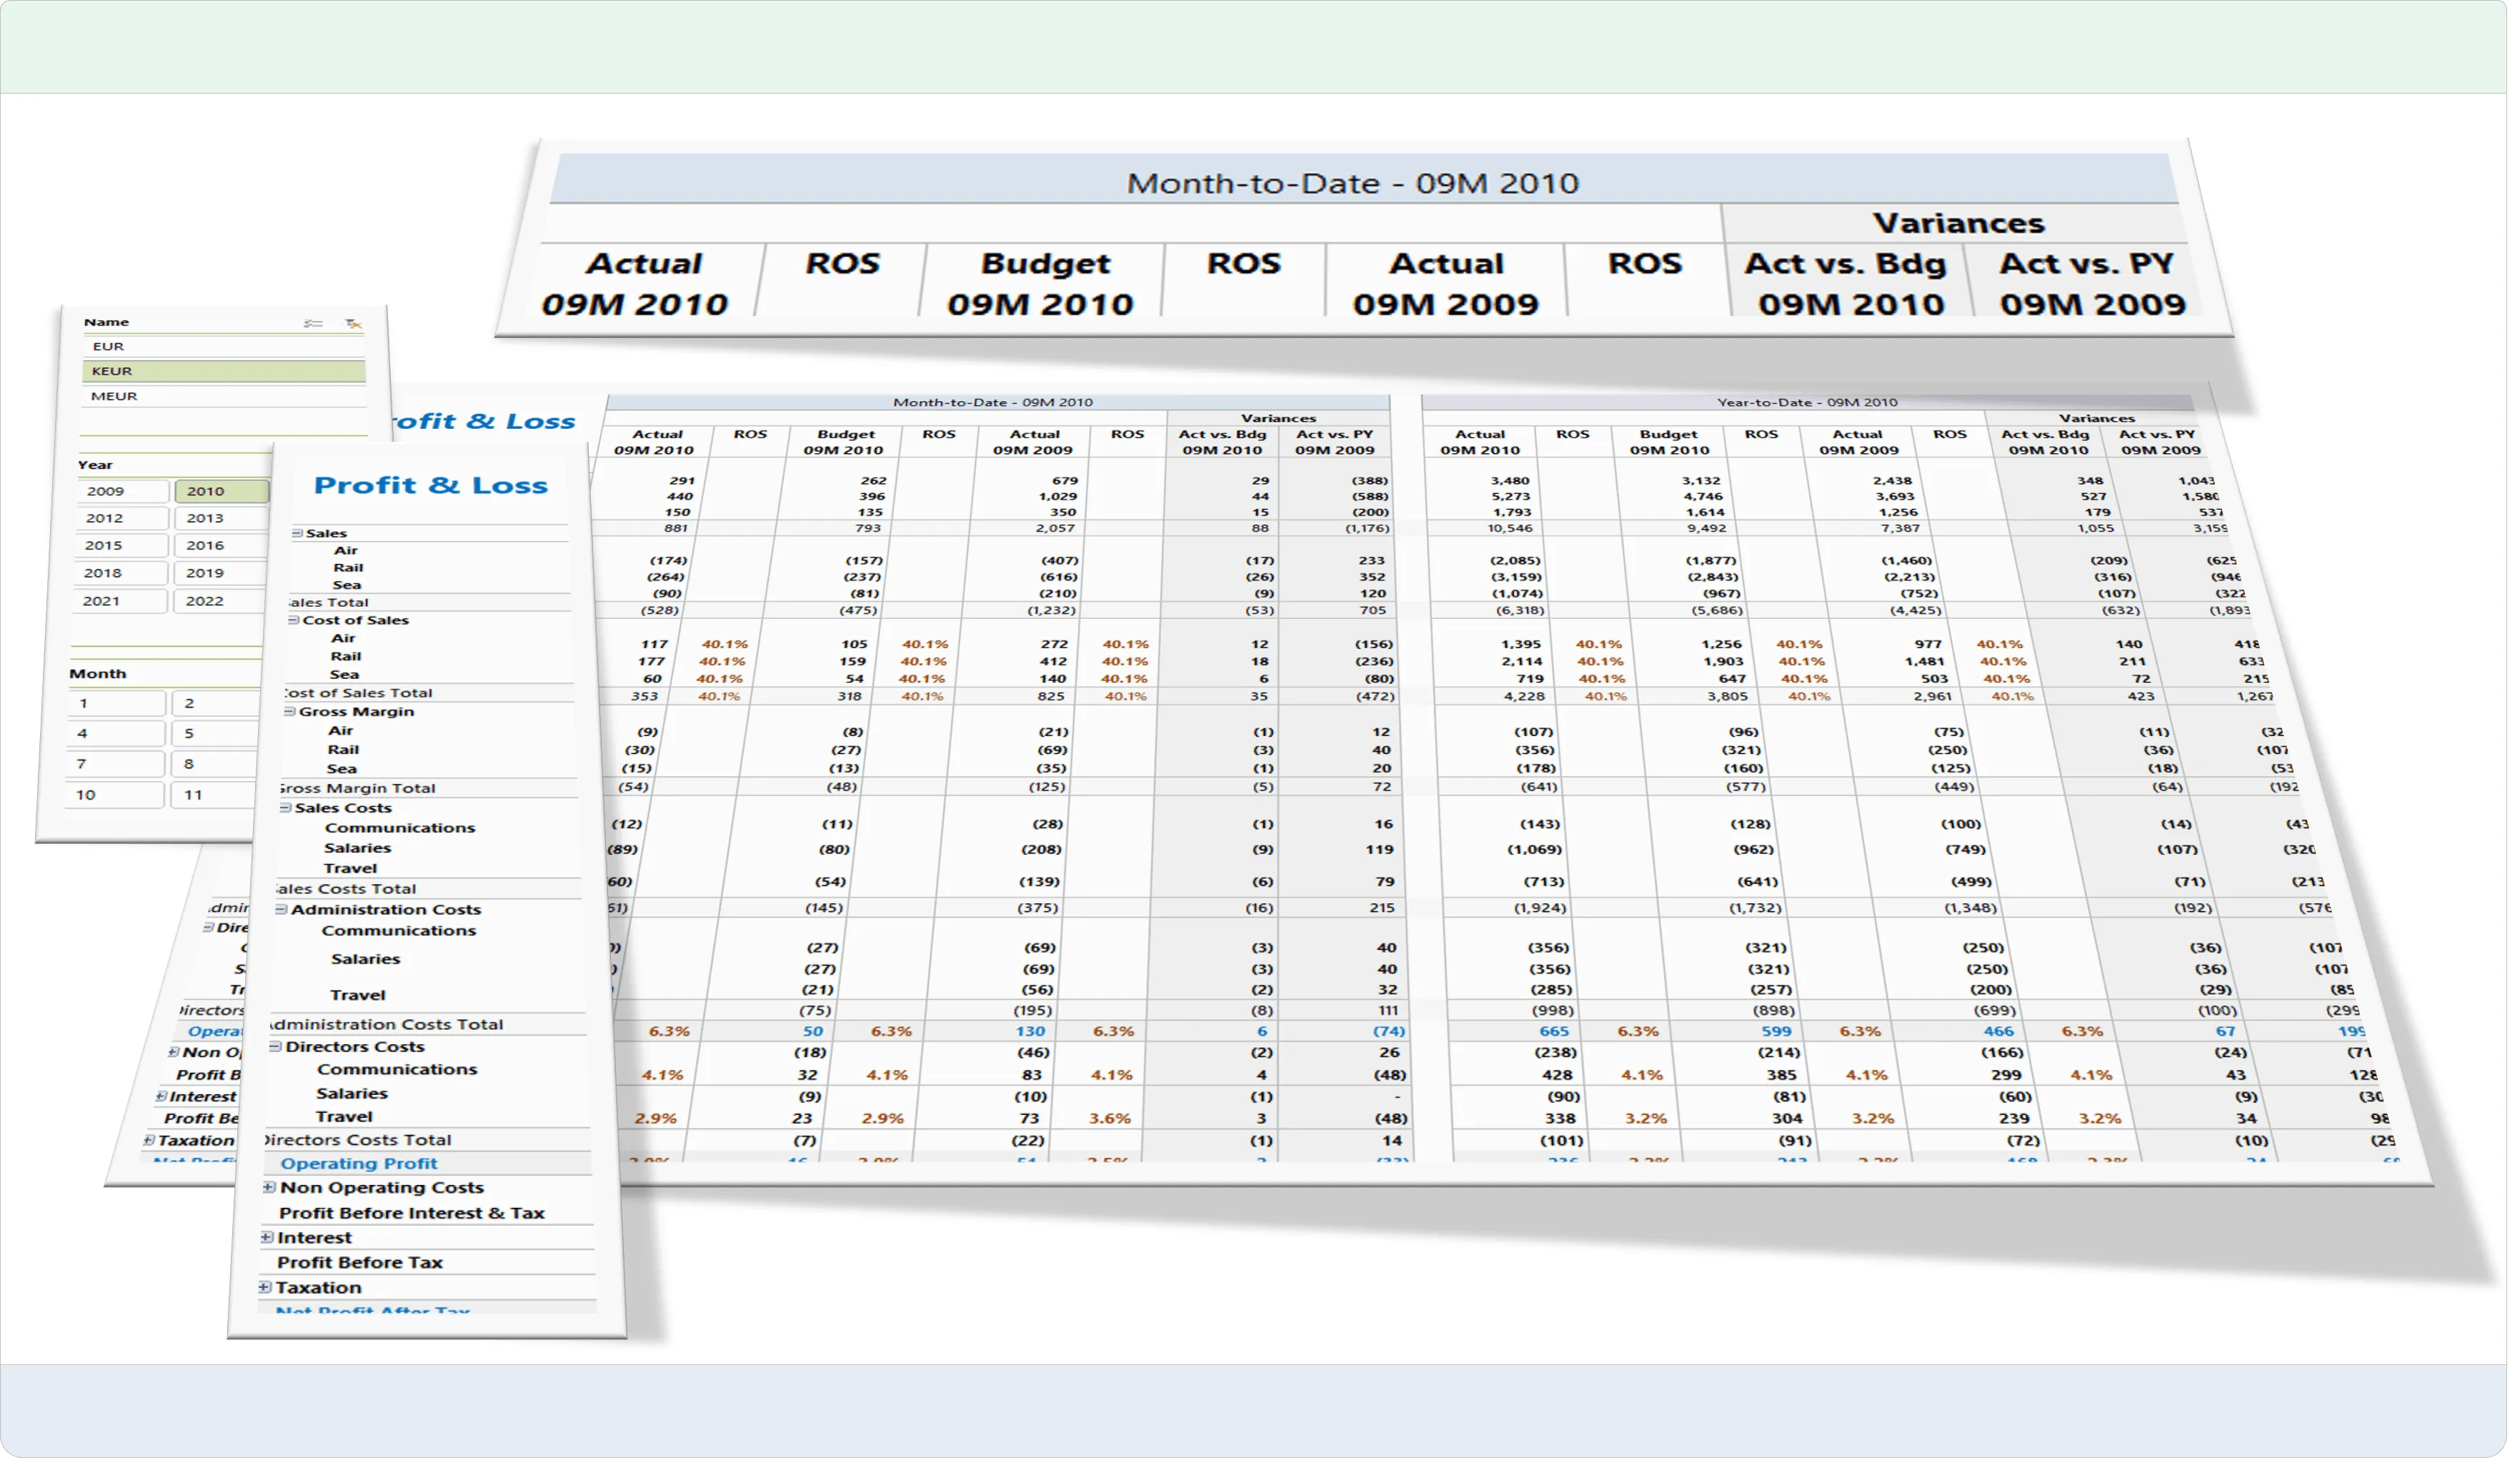
Excel & Financial Management
A two-day workshop for the financial analysts that want to learn a fully automated approach to create Profit & Loss Statements using the same technology as Power BI for data shaping and modeling. Discover how to report actuals, variances, comparisons versus budget and last year, both absolute and relative. At the end, a P&L Statement with dynamic headers is created respecting BI best practices.
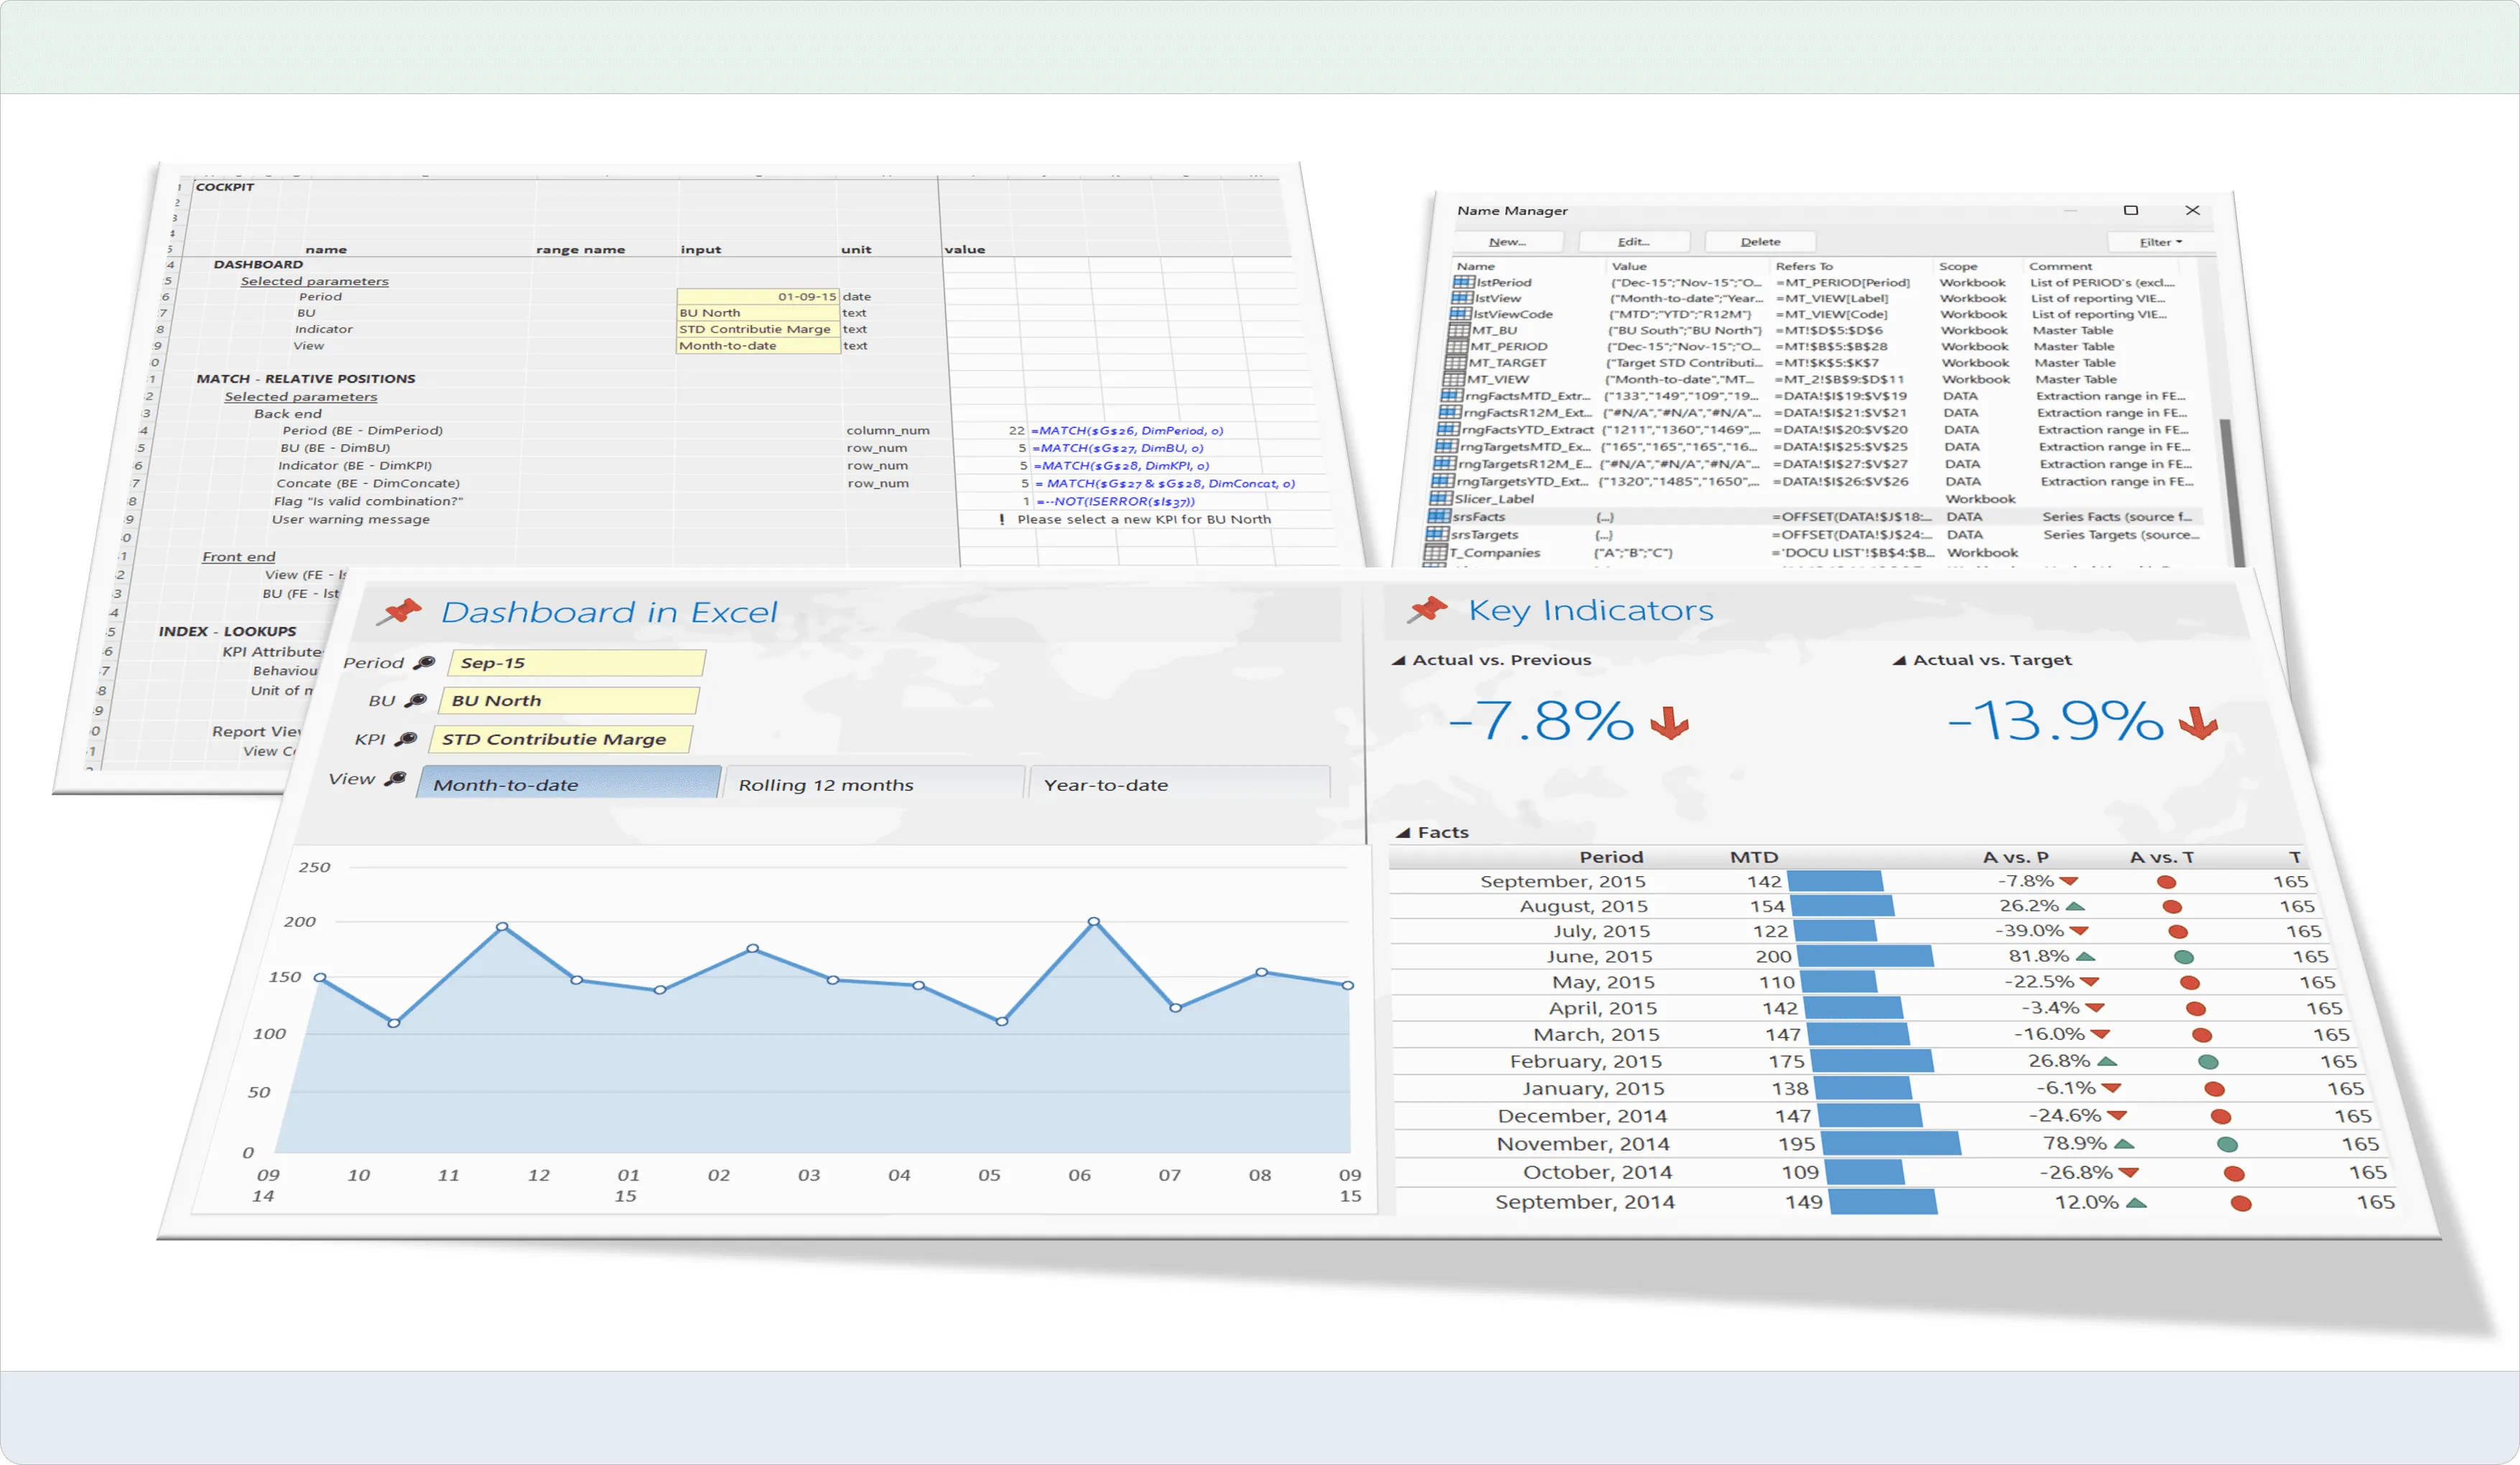
Dashboards in Excel
A totally renewed two-day workshop to create Excel reports by applying the same technology as Power BI for data shaping and modeling. Everything you learn here will also be 100% applicable in Power BI so an investment well spent. Learn how to create powerful PivotTable- and PivotChart based reports. But also, how to develop legacy reports that require more flexibility than PivotTables.

Can't find the course you are looking for?
Contact us to explore options for a tailored training

Tailored coaching for your unique needs
- Our custom coaching solutions are crafted to accelerate your organisation
- Experience personalized coaching from in2Facts, designed to address your organisation’s specific challenges.
- Our bespoke coaching delivers relevant skills and knowledge to accelerate your team to new insights to apply directly to your business scenarios.